
DOI: 10.58867/WWNS3896
The European Union (EU) is introducing a Carbon Border Adjustment Mechanism (CBAM) to prevent carbon leakage under the EU emissions trading system (ETS) and support the mitigation ambitions of the EU and of other countries.[1] The CBAM will require certain importers to purchase and surrender CBAM certificates to cover emissions embodied in imported goods. This will increase the cost of these imported goods, with the additional cost reflecting the emissions-intensity of each product, sending a price signal to importers to reduce emissions and to EU consumers to preference low-emissions alternatives. It also provides a level playing field for domestic producers in these sectors, as going forward both they – and their import competitors – will be subject to a carbon price.
The obligation on importers will be reduced for products already subject to carbon pricing in their country of origin. This provides an opportunity for countries to implement domestic carbon pricing, effectively reclaiming government revenues that would otherwise be payable to the EU.
The CBAM will be closely related to the EU Emissions Trading System (EU ETS) in its scope and operation. The CBAM price will mirror the weekly EU ETS permit price, The CBAM obligation will also be adjusted to take into account any free allocation of EU ETS permits that EU industry receives in the relevant sector.
The embodied emissions of covered products will generally be determined based on each importer’s emissions measurement, reporting and verification (MRV). Where importers do not have sufficient data to demonstrate the emissions associated with their products, a default value will be applied. In this case, the default will be based on the worst-performing EU installations. This means that producers that can demonstrate relatively low emissions intensity of production will face lower CBAM costs, while those without reliable MRV will pay the potentially higher EU-based default rate.
The CBAM will come into full force in 2026, with a transitional phase from 1 October 2023 to 31 December 2025. During the transitional phase importers will report the embedded emissions in covered products. The CBAM will initially cover Scope 1 (direct) emissions from certain products in the Iron and Steel, Cement, Fertilizers, Electricity, Hydrogen and Aluminum sectors, plus scope 2 emissions for Cement and Fertilizers. The EU intends to expand coverage of the CBAM to other emissions-intensive, trade exposed (EITE) products under the EU ETS such as glass, chemicals, petroleum and other fossil fuels.
The impact of the CBAM on each country will ultimately depend on many factors, including the proportion of their production covered by the CBAM, the elasticity of demand for covered products, the level of cost pass-through to consumers, each country’s emissions intensity of production and emission reduction opportunities relative to that of competitors, opportunities to divert exports to other countries, and the ability for exporting countries to robustly measure and report emissions. This paper explores the potential impact of the CBAM on Türkiye's economy.
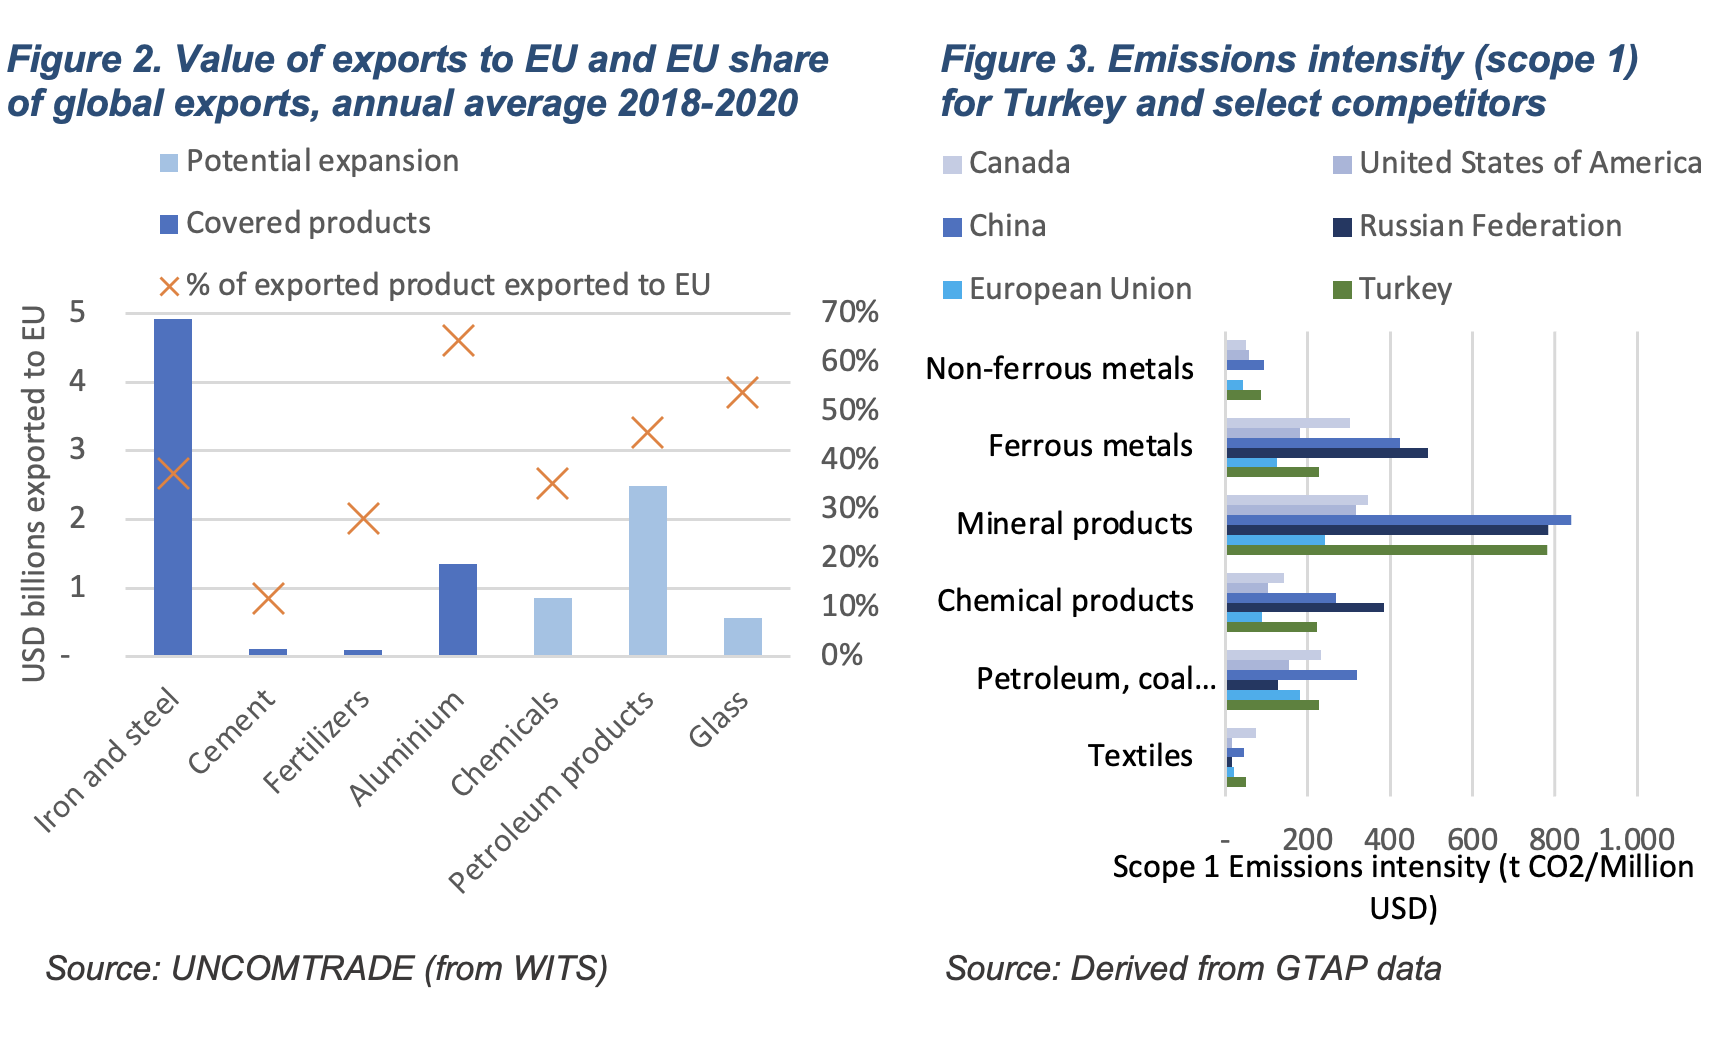
Around 4% of Türkiye’s total goods exports by value would be subject to the CBAM in its early stages (Figure 1). The industry sector of most concern is Iron and Steel. Exports to the EU of covered products in this industry represent 3% of Türkiye’s total goods exports (Figure 1). Nearly 40% of Türkiye’s Iron and Steel exports go to the EU (Figure 2). The emissions intensity of Türkiye’s ferrous metals sector is estimated at 226 tCO2e/Million USD (Figure 3)[2]. When compared with other major exporters, this is higher than that for the EU (124 tCO2e/Million USD) and Republic of Korea (149 tCO2e/Million USD), though lower than China (422 tCO2e/Million USD) and Russia (492 tCO2e/Million USD).[3] About 70% of Türkiye’s steel production uses scrap metal in electric arc furnaces, keeping emissions intensity below many competitor countries.
Figure 1: Share of Türkiye's Goods Exports by Value (2018-2020 Average)
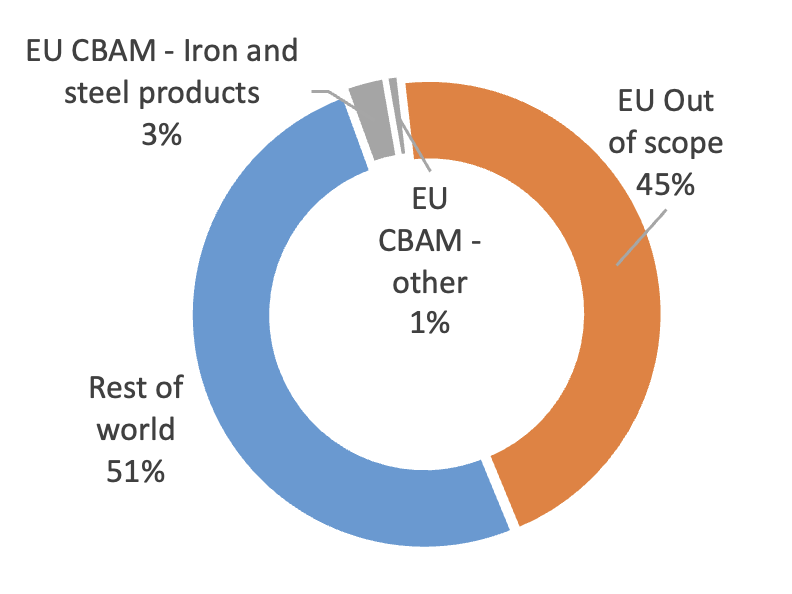
Aluminum production, which accounts for most of the remaining 1% of Türkiye’s exports to be covered under the current proposal, is also highly exposed. 64% of exports of covered Aluminum products go to the EU. These exports are worth nearly US$1.4 billion a year. The emissions intensity of Türkiye’s production of non-ferrous metals (including aluminum), at 85 tCO2e/Million USD, fares slightly better when compared with other major exporters: the EU 42 tCO2e/Million USD, China at 93 tCO2e/Million USD.
If, or when, the CBAM scope is expanded, Türkiye faces risks in other emissions-intensive sectors exposed to the EU. This includes petroleum products, in which nearly 50% of Türkiye’s US$2.5 billion annual exports go to the EU, and glass, in which 54% of exports also go to the EU.

Findings from Modelling the Economic Impact of EU CBAM
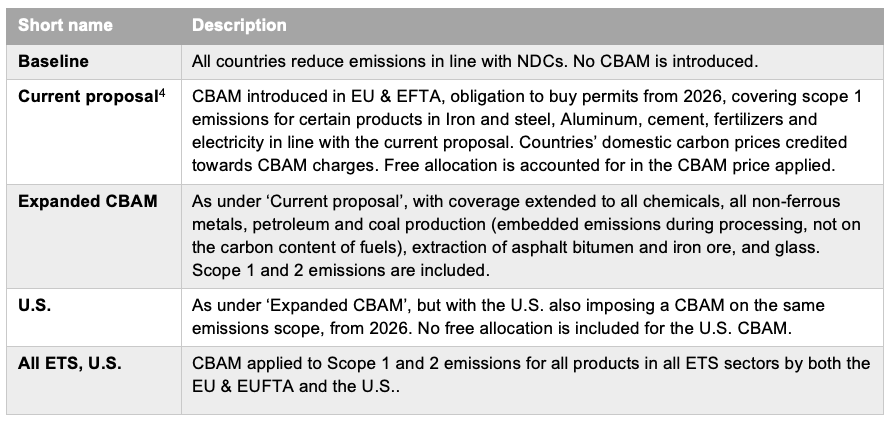
In order to quantify the potential impact of the CBAM on Türkiye’s economy and that of other countries in Europe and Central Asia (ECA) the World Bank has undertaken macroeconomic modelling. The modelling explores the impact on the economy overall, as well as on individual sectors. It also investigates what might happen under different CBAM coverage and if the US adopted a similar mechanism. The scenarios modelled and discussed in this paper are outlined in Table 1.
Table 1: Modelled Scenarios
The CBAM is Forecast to have Major Impacts for Some Sectors
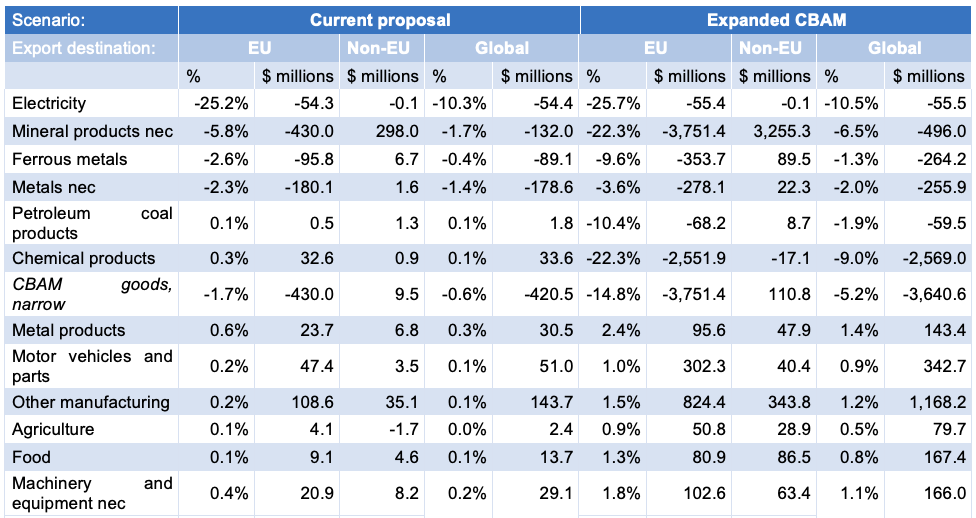
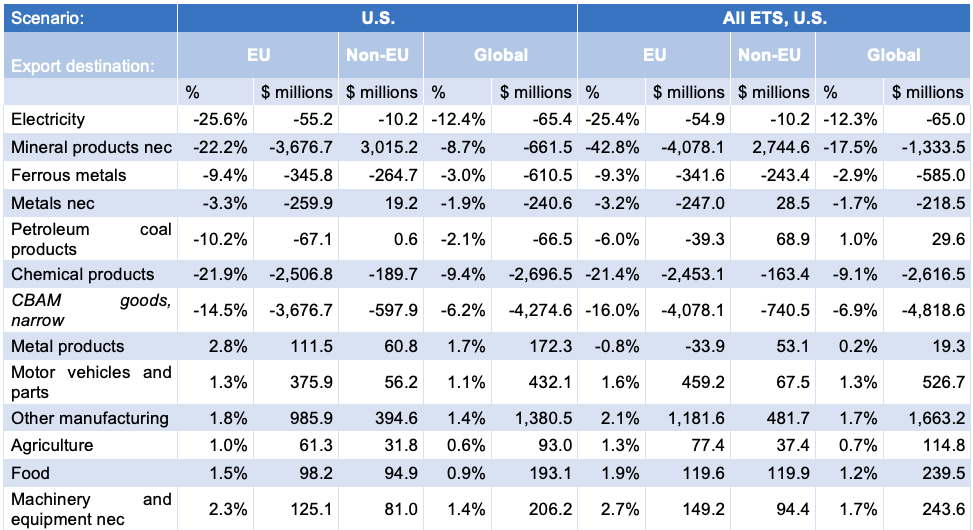
The biggest impact from the CBAM is lower exports to the EU of products covered by the CBAM (Figure 4, Table 1). This is the result of the European countries substituting imports with domestic production, switching to imports from other countries where the emissions intensity of production might be lower, or reducing consumption entirely. Exports of mineral products, such as cement, to the EU would be around 5.8% lower under the ‘Current Proposal’ compared with the ‘Baseline’ scenario where there is no CBAM. Under this scenario, scope 1 emissions from most cement products are covered but other mineral products, such as glass, and scope 2 (electricity use) emissions are not. The reduction in mineral product exports to the EU could be as much as 42.8% with coverage of the sector broadened beyond cement and scope 2 emissions included (‘Expanded CBAM’, ‘U.S.’, ‘All ETS, U.S.’). Reflecting the Iron and Steel (Ferrous metals) sector’s exposure, exports to the EU could be 2.6% lower under ‘Current Proposal’, but around 10% lower if scope 2 emissions are included (‘Expanded CBAM’, ‘U.S.’, ‘All ETS, U.S.’). In scenarios where Petroleum products and scope 2 emissions are covered, exports of petroleum and coal to the EU could be more than 10% lower (‘Expanded CBAM’). The impact on the Chemicals sector is expected to be substantial if it is captured broadly by the CBAM and scope 2 emissions are included – exports to the EU are more than 20% lower than under the baseline (Expanded CBAM’, ‘U.S.’, ‘All ETS, U.S.’). [5] In contrast, some higher value-added sectors could achieve higher exports to the EU through improved competitiveness compared with EU producers, who face higher costs when some of their inputs are subject to the CBAM. For example, sectors like Metal products, Motor Vehicles and Parts, Machinery and Equipment, Food, and Agriculture could see marginally higher exports under the ‘Current Proposal’, and a 1%-3% bump under scenarios with broader CBAM coverage.

When considering the value of exports, the chemical products sector faces potential forgone exports to the EU of around $2.5 billion in 2030 (Table 1, ‘Expanded CBAM’, ‘U.S.’, ‘All ETS, U.S.’).[6] Combined lost exports to the EU from sectors most likely to be subject to the CBAM could be between $430 million (‘Current Proposal’) and $4 billion (‘All ETS, U.S.’) in 2030 alone.
The modelling suggests some portion of exports of some products can be diverted from the EU to other countries. For example, of forgone exports of ferrous metals to the EU of over $350 million in 2030 under ‘Expanded CBAM’ over a quarter (nearly $90 million) are diverted to non-EU countries. Some diversion is also possible for ‘petroleum and coal products’, ‘metals nec’, and ‘mineral products’. Around 3% of forgone exports of CBAM goods overall can be diverted in this scenario. For the higher value-added sectors there is potential for higher exports also to non-EU countries, again reflecting improved competitiveness compared with EU producers.
Table 2: Modelled real exports in 2030, select sectors, deviation from ‘Baseline’
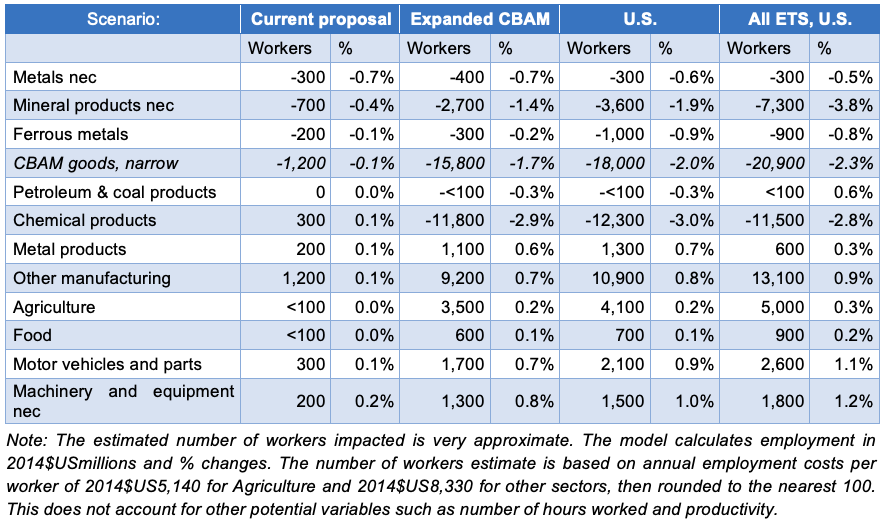
Reflecting the impact on sectoral exports, some sectors face lower output (Figure 5) and employment (Figure 6, Table 2). The extent to which changes in exports impact the sector’s output depends largely on the portion of the sector’s outputs that are exported. The sector most affected is non-ferrous metals (‘Metals nec’ eg. Aluminum), which sees the value of output in 2030 0.6% lower under ‘Current proposal’ than under the ‘Baseline’. This represents lost output of nearly $170 million in 2030. For other covered sectors the expected change in output under the ‘Current proposal is between -0.1% (Ferrous metals, Other Mining) to 0.4% (Mineral products nec). However, with broader CBAM coverage (‘Expanded CBAM, U.S., ‘All ETS, U.S.’) the value of output in chemical and mineral sectors could decline up to 3.6%. The overall decline in output for sectors most likely to be covered by the CBAM is between 1.4% and 1.8% for ‘Expanded CBAM’ and other scenarios with broader CBAM coverage. Changes in employment by sector follow similar patterns to output. For example, under ‘Expanded CBAM’, the 2.7% decline in output for chemicals translates to a 2.9% decline in employment, the 1.3% decline in mineral products output results in 1.4% lower employment.
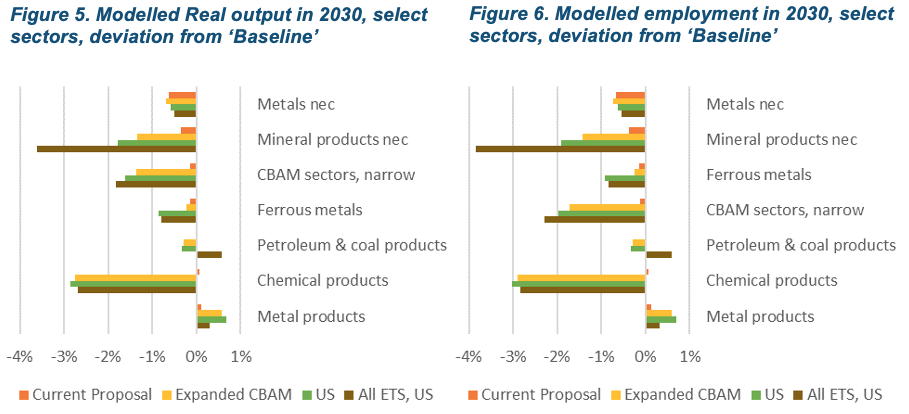
Table 3: Indicative employment in 2030, select sectors, deviation from ‘Baseline’
But the economy-wide effects are small.
Total exports to EU countries see small deviations from the baseline, reflecting that lower exports in covered sectors are offset by higher exports for value-added sectors (Figure 8). In 2030, these exports are forecast to be 0.1% lower under the current proposal, 1.3% lower under an ‘Expanded CBAM’ and around 1% lower if the U.S. also adopts a CBAM (‘U.S.’, ‘All ETS, U.S.’). This represents up to around $2 billion in forgone exports in 2030.

As noted, Türkiye is able to divert some of these exports to other countries, so the impact on total global exports is smaller. Under the ‘Current proposal’, total exports are less than 0.03% lower in 2030 compared with the baseline, or $93 million. Under more ambitious scenarios the impact is larger, but still very small – 0.3% lower than the baseline under an expanded CBAM, if the U.S. adopts a similar scheme, or with ambitious expansion and U.S. adoption. Under all scenarios Türkiye ’s exports are expected to see strong growth, with real exports in 2035 more than 70% higher than in 2020 under every scenario.
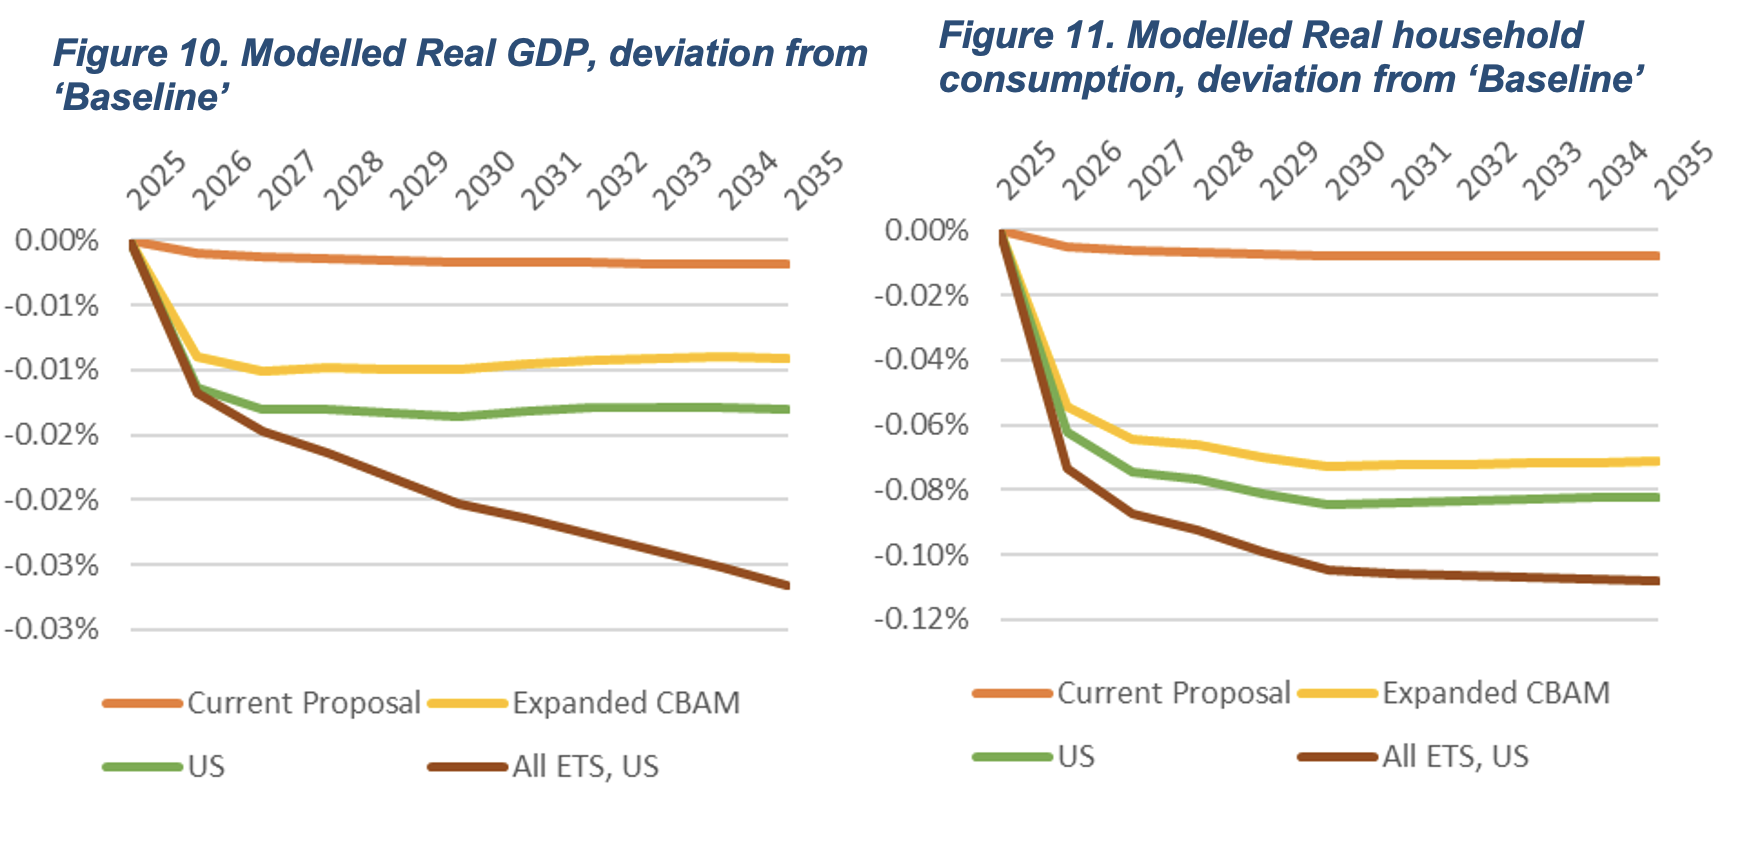
The modelling shows a very minor, though negative, macro-economic impact on Türkiye from the CBAM (Figure 10). The model forecasts Real GDP in 2030 marginally lower than under the ‘Baseline’ if the CBAM is implemented as currently proposed (-0.0017%, $24 million). This remains the case even with an expanded CBAM (-0.0100%, $142 million), the U.S. adopting a similar mechanism (-0.0136%, $194 million), or even an ambitious expansion of the CBAM and U.S. adoption (-0.0203%, $290 million).Under this most ambitious scenario the proportional impact continues to worsen over time. The impact on household consumption is more pronounced but still small: up to around 0.1% impact under the most ambitious coverage scenario (Figure 11).
The Impact of the EU CBAM can be Considerably Reduced if Türkiye Takes Action to Reduce Emissions
As part of this assessment, the impact of Türkiye taking action to reduce emissions was modelled. A carbon price was modelled as a proxy for climate mitigation policy with the benefit that the carbon price would be deducted from the CBAM applied. The scenarios modelled are outlined in Table 4.
Table 4: Scenarios modelled of action to reduce emissions.
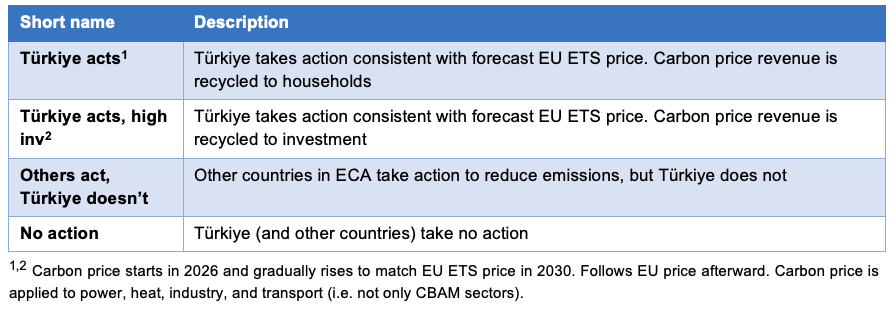
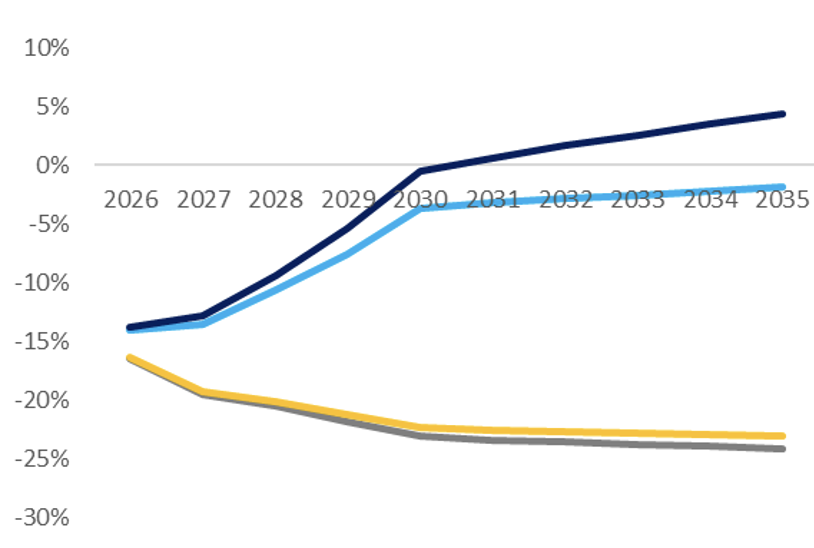
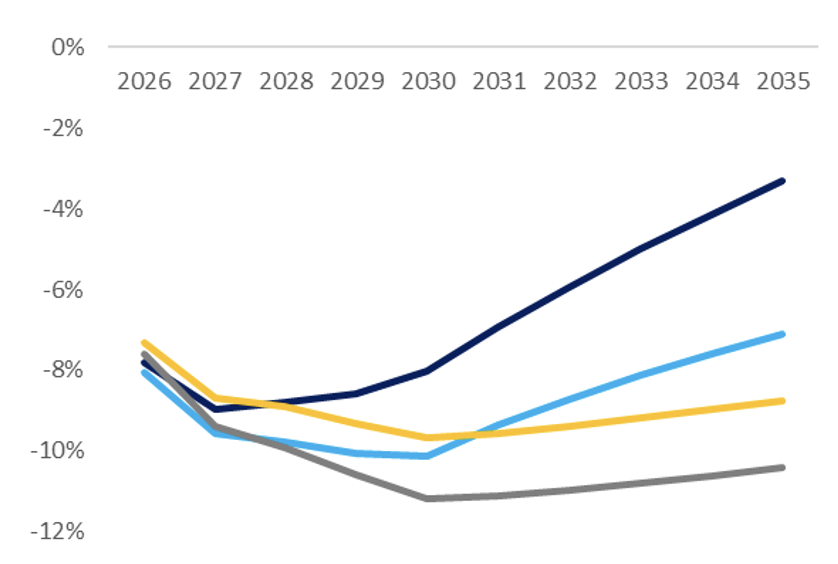
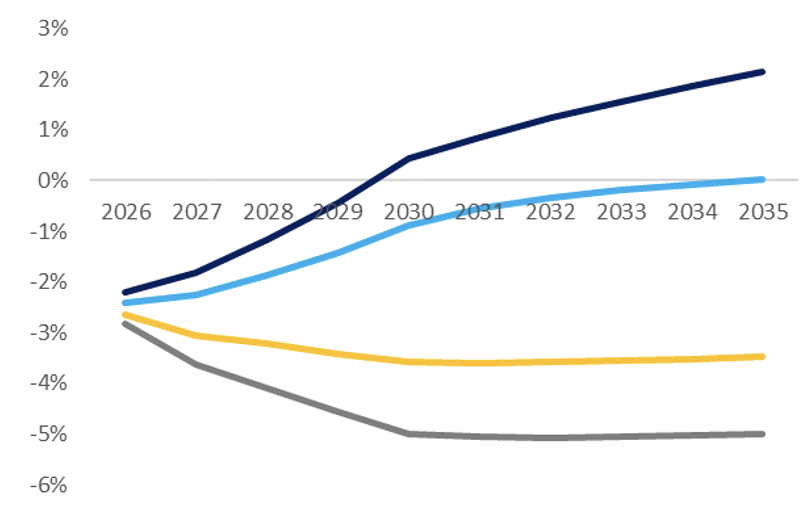
Taking action to reduce emissions lowers the impact of CBAM on exports to the EU. By lowering their emissions, some sectors, such as chemicals and aluminum, can actually grow their exports to the EU beyond what they would be without a CBAM. By taking action, Türkiye can become more competitive in EU markets. In all cases, exports to the EU suffer the most if Türkiye takes no action to reduce emissions and other countries in the region do take action, as market share is lost to competitors.
|
Figure x. Exports to the EU - Chemicals
|
Figure x. Exports to the EU – Ferrous metals
|
|
|
|
|
Figure x. Exports to the EU – Metals
|
Exports to the EU – Petroleum products
|
|
|
 
|
|
Legend:
|
 
|
In many ways, the EU CBAM is an opportunity for Turkish industry. Türkiye is in a good starting position – it has made a good start in decarbonizing its power sector, and it has geographical proximity and strong trade relations with the EU. Türkiye could capitalize on these advantages and, by decarbonizing industry, become more competitive in a low-carbon world.
[2] Emissions intensities in this paper (unless otherwise stated) are based on GTAP data.
[3] Figures are derived from GTAP data. Due to the high level of sector aggregation, comparisons between countries mask differences in the outputs of sectors between countries. For example, glass and cement are both included in ‘mineral products’. If one country’s production is concentrated in more energy-intensive cement, their emissions intensity (expressed per Million USD of output) may seem higher than a country whose focus is on glass, and these countries may not be competitors. This metric does however provide a useful guide to the cost of a carbon price relative to production value. GTAP data does not include all emissions (for example CO2 emissions from industrial processes).
[4] Although the final CBAM agreement includes Hydrogen, this modelling exercise, conducted before the starting scope was finalized, does not include Hydrogen in [any] scenarios. Including Hydrogen would be unlikely to have a meaningful impact on the modelling results out to 2030, given current Hydrogen production is small and the future production and use is uncertain. However, Türkiye’s Hydrogen Roadmap demonstrates the country’s plans to ramp-up hydrogen production, so hydrogen’s inclusion could have implications in the longer-term.
[5] Under ‘Current proposal’, only fertilizers are covered. ‘Expanded CBAM’ includes all chemical products.
[6] All modelled $ values in this note are constant 2014 US$.